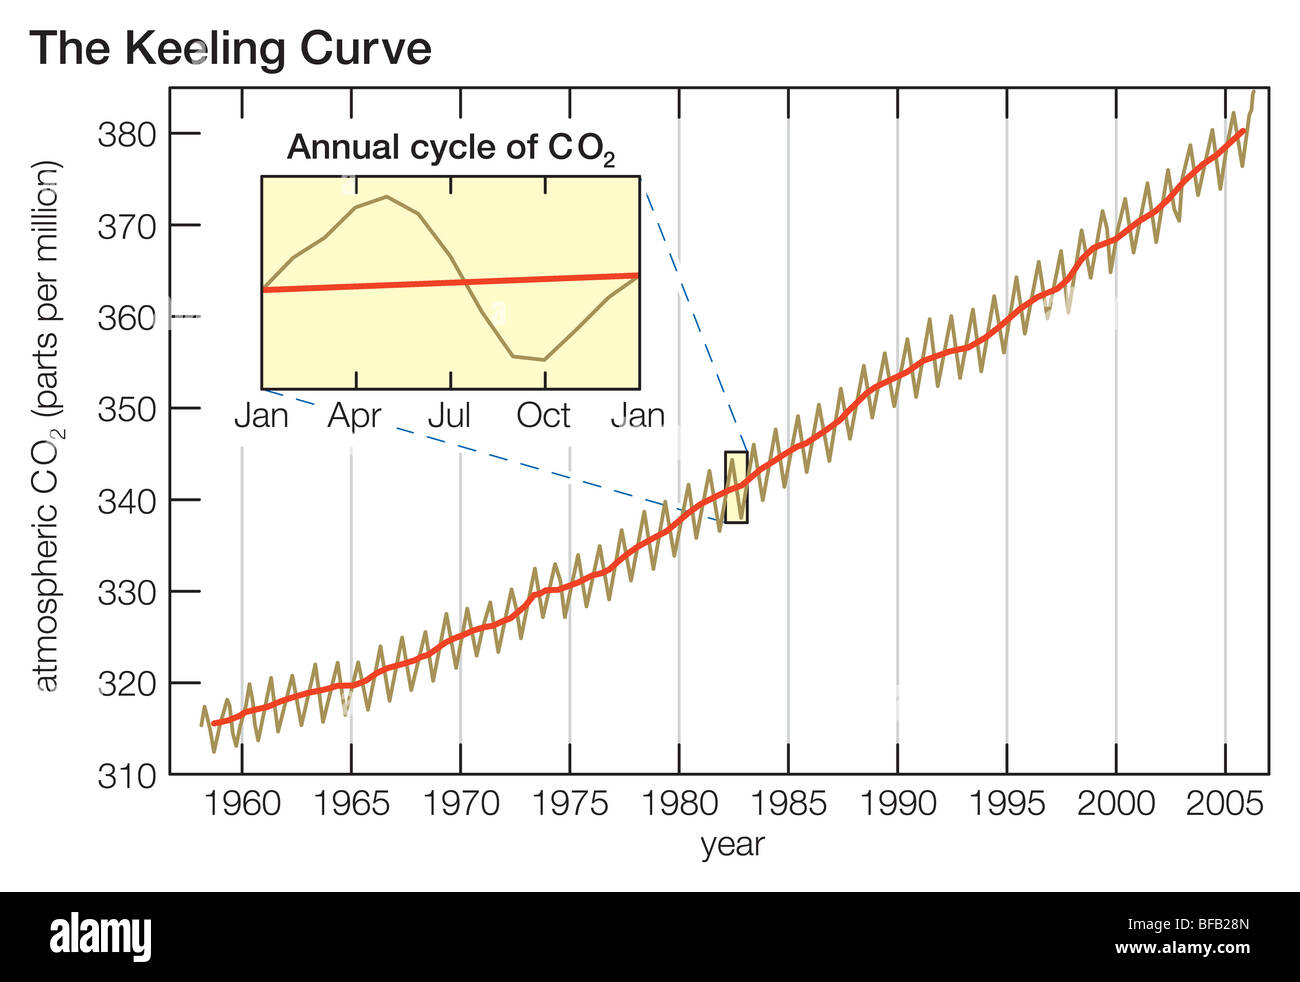
The Keeling Curve is a graph of the accumulation of carbon dioxide in the earths atmosphere based on continuous measurements taken at the Manua Loa Obsorvatory on the island of Hawaii from 1958 to the present day. The curve is named for the scientist Charles david Keeling, who started the monitoring program and supervised it until his death in 2005.
Keeling’s measurements showed the first significant evidence of rapidly increasing carbon dioxide levels in the atmosphere According to Dr Naomi Oereskes Professor of History of Science at Harvard University the Keeling curve is one of the most important scientific works of the 20th century Many scientists credit the Keeling curve with first bringing the world’s attention to the current increase of carbopn dioxide in the atmosphere.
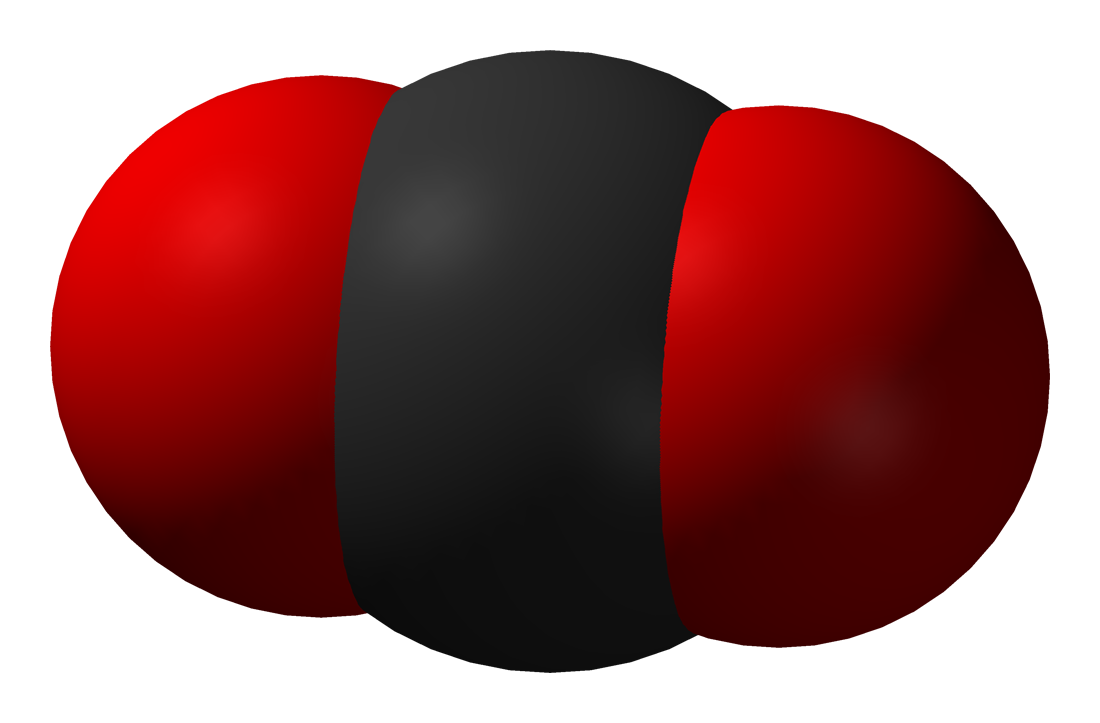
Carbon dioxide, or CO2, is a very common, naturally occurring molecule that contains two oxygen atoms and one carbon atom. In everyday conditions on Earth, carbon dioxide is a commonly occurring gas that is all around us. It is colourless, odourless, is naturally present in Earth’s atmosphere and is an important part of Earth’s carbon cycle. All humans and animals exhale carbon dioxide when they breathe, and plants absorb it during a process called photosynthesis in order to grow.
Greenhouse gases are gases that can trap heat. They get their name from greenhouses. A greenhouse is full of windows that let in sunlight. That sunlight creates warmth. The big trick of a greenhouse is that it doesn’t let that warmth escape.

Daniel Horn 9BL1
